

Beyond ΔP: A More Complete Approach to RO Membrane Cleaning
Reverse osmosis (RO) membranes are indispensable in water treatment and desalination systems, offering high rejection of salts and contaminants. Yet, like any separation technology, they are vulnerable to fouling and scaling, which degrade performance, increase operating costs, and shorten membrane life. To restore efficiency and prevent permanent damage, operators rely on periodic Clean-in-Place (CIP) procedures.
Knowing when to clean and whether a cleaning was truly effective is critical to preserving efficiency and protecting the membranes. Unfortunately, there are still many misconceptions in the industry about how to make those determinations.
A common practice is to trigger cleaning when differential pressure (ΔP) rises. While ΔP is a valuable metric, it only tells part of the story. Fouling often begins long before ΔP changes, and in many cases a membrane can suffer severe permeability loss or salt passage increase without any noticeable shift in pressure drop. By the time ΔP does increase, the foulant layer is usually well-established, harder to remove, and may already have caused irreversible membrane damage.
This article makes the case for a more complete approach to RO membrane cleaning. By relying on normalized data and monitoring multiple performance indicators together, operators can detect fouling earlier, make informed cleaning decisions, and extend membrane life well beyond what ΔP-only monitoring can achieve.
Why ΔP Alone Is Not Enough
Differential pressure (ΔP) measures the pressure loss between the feed and concentrate caused by friction as the water moves through the membrane feed channels. As deposits build up and restrict flow, friction increases and ΔP rises.

The problem is that ΔP only starts to increase once fouling is thick enough to obstruct the feed spacers. By then, the deposits are much harder to remove and may already have caused irreversible performance loss.
- Early fouling goes undetected: ΔP is a late-stage indicator. Aside from debris breakthrough, ΔP doesn’t capture early fouling on the membrane surface and only begins to rise once the feed channels are restricted. This leaves operators blind to early-stage issues
- Different foulants behave differently: Silica forms a thin, glass-like layer that significantly reduces permeability long before ΔP changes. Organic fouling behaves similarly by creating a layer that lowers permeability but usually won’t affect ΔP unless it also serves as a carbon source for bacteria, leading to biofilm formation. In contrast, some mineral scales, like calcium carbonate or calcium sulfate, tend to produce more pronounced ΔP spikes. The challenge is that ΔP alone won’t necessarily tell you if fouling is occurring until it’s potentially too late, creating dangerous diagnostic blind spots.
- False sense of success: A cleaning that clears feed channel obstructions but leaves material on the membrane surface (common with biofilm or silica) may lower ΔP and appear successful. In reality, the foulant remains, ensuring that the scales or biofilms regrow faster, and shortening the intervals between cleanings. This happens because residual biofilm on the membrane surface continues to obstruct permeate production. To maintain the same overall flow, the cleaner portions of the membrane are forced to operate at a higher flux. That elevated local flux drives more foulants onto the membrane surface in the same amount of time, accelerating the rate of fouling and making the system deteriorate more quickly than before.
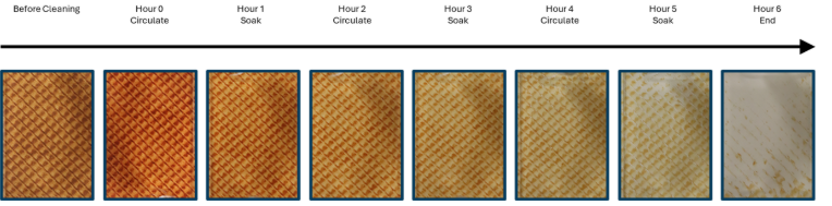
ΔP is therefore a useful alarm flag, but used in isolation, it conceals early warning signs and can mask ineffective cleanings.
Why Normalization is important:
Raw operating data can be misleading. Factors such as seasonal temperature changes, shifts in feedwater TDS (such as when different well combinations are used), variations in operating recovery, or fluctuations in feed flow all change membrane performance parameters such as feed pressure, differential pressure, permeability, and salt rejection, even when no fouling is present. Without correcting for these variables, operators may mistake natural variability for fouling, or worse, overlook real fouling that is hidden by those changes.
Normalization is the process of adjusting performance data back to baseline conditions (typically startup). It strips away the influence of temperature, operational changes, and feedwater composition so that changes in performance reflect only the condition of the membranes to be a true indication of change of membrane performance.
- Temperature: Colder water is more viscous and increases the friction of the water against the feed channels, increasing dP, even if no fouling is present. Temperature changes can also impact water flux and salt passage through the membrane to the permeate side. Normalization removes these seasonal effects so increase feed pressure or dP indicate fouling, not the weather.
- Feedwater salinity (osmotic pressure): Net driving pressure (NDP) is the pressure available to push water through the membrane after accounting for osmotic pressure. When feedwater salinity increases, osmotic pressure rises and NDP drops. As a result, operators may see higher feed pressures or lower permeate flows even though no fouling has occurred. For example, switching to a well with higher salinity, or gradual saltwater intrusion raising TDS levels over time, can misleadingly suggest fouling, when in reality it’s simply the effect of osmotic pressure increases. Normalization corrects for this, ensuring reduced flow or higher pressure isn’t misinterpreted as fouling.
- Operational changes: Variations in operating conditions, such as feed flow or recovery, also affect other parameters. For example, as flow increases, friction rises and ΔP goes up, even without fouling. A plant that changes operating setpoints may therefore see shifts in ΔP unrelated to membrane condition. Additionally, with organic fouling, a thin layer may not increase ΔP directly, but by reducing 1st stage permeate, it forces more water into the 2nd stage, creating a ΔP rise there instead. Only normalization can reveal that the 1st stage is actually the source of the problem. Without normalization, these changes can easily be misdiagnosed as fouling.
By normalizing performance data, operators can accurately determine when membrane performance is truly changing, when a cleaning is needed, and whether the cleaning was effective. Without normalization, fouling can progress unnoticed, while unrelated operational or water quality changes may misleadingly trigger unnecessary cleanings – wasting time, chemicals, and ultimately shortening membrane life.
Performance Indicators: A Multi-Parameter Approach
To accurately assess membrane performance, operators should track multiple normalized indicators. A single metric on its own can be misleading, but when viewed together, the trends provide a clear and reliable picture of membrane health and system condition.
|
Indicator |
What It Shows | Typical Alarm Threshold* |
| Normalized Permeate Flow | Declining flow indicates fouling that interferes with water passing through to the permeate side. | 10-15% decline |
| Normalized Salt Rejection | A change in salt passage can indicate fouling covering the surface or potential membrane damage | 10-15% change |
| Normalized ΔP | Increased hydraulic resistance (friction) from deposits narrowing feed channels | 20-30% increase |
* General guidelines – specific systems may require tighter or looser limits; always consult the membrane manufacturer.
Key point: No single metric tells the whole story. Cleaning decisions should be based on the combined trends of all three – normalized flow, salt passage, and ΔP. Together they not only determine when to clean but also confirm whether the cleaning was effective. If normalized performance does not recover after a CIP, it is often a sign that the foulant wasn’t fully removed or that a different cleaning protocol is required.
Diagnosis & Corrective Actions
Because ΔP alone can be misleading, effective diagnosis requires looking at all normalized performance indicators together and interpreting the patterns they reveal.
- Flow declines without ΔP change: This often points to early-stage fouling that hasn’t gotten thick enough to block the feed spacers – common with organic fouling or colloidal silica fouling or silica scaling – or to membrane compaction from prolonged high operating pressures, especially at warm feedwater temperatures. In the case of compaction, the lost permeability cannot be restored, which is why it is critical to clean before the threshold is exceeded.
- Salt passage increases: A rise in normalized salt passage may suggest membrane oxidation, delamination, or physical damage (e.g., suspended solid abrasion). Scale formation and fouling can also damage the delicate membrane layer; once that layer is punctured, cleaning may remove the deposits but leave behind permanent salt rejection loss that becomes increasingly apparent upon foulant removal.
- Salt passage decreases: In some cases, biological or organic fouling can form a light coating on the membrane surface that improves salt rejection while simultaneously reducing available surface area for permeate production. This usually coincides with a decline in normalized permeate flow.
- ΔP rises: A sustained increase indicates deposits thick enough to obstruct feed channels. Operating under high ΔP for extended periods not only accelerates fouling but also risks irreversible and severe mechanical damage, such as feed spacer protrusion or even membrane telescoping.
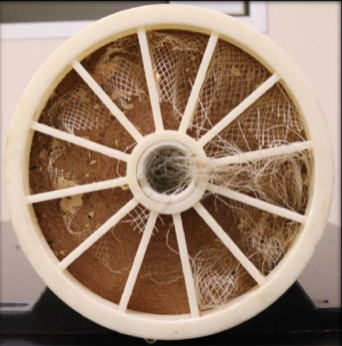
By combining these indicators, operators can distinguish between different fouling mechanisms and identify where in the system the problem is occurring. For example, a decline in normalized flow paired with a normalized ΔP increase in the 2nd stage often points to scaling, while the same pattern in the 1st stage could suggest fouling.
When performance trends are not sufficient to diagnose an issue with certainty, more advanced diagnostics are available. A membrane autopsy can confirm the foulant type and extent of damage, while a cleaning study can evaluate which CIP protocol is most effective. These specialized services are often provided by specialized membrane chemical suppliers and can be invaluable in both troubleshooting persistent issues and optimizing long-term maintenance strategies.
Conclusion
Protecting RO membrane performance requires more than watching for a rise in differential pressure. ΔP is an important metric, but used alone it is a late-stage alarm that misses early fouling, conceals incomplete cleanings, and can lead to irreversible damage.
A more reliable strategy rests on three pillars:
- Normalization to account for the effects of temperature, salinity, and operating changes so true fouling trends are visible.
- Multi-parameter monitoring of normalized permeate flow, normalized salt passage, and normalized ΔP to provide a complete picture of membrane health.
- Disciplined CIP practices that use the right chemistry and cleaning procedure for the specific foulant, ensuring deposits are fully removed and cleanings deliver lasting recovery.
When operators integrate these practices, they move from reactive cleaning to proactive maintenance. The result is earlier detection of fouling, more effective cleanings, longer intervals between interventions, and ultimately, extended membrane life at lower operating cost.
The takeaway: Don’t let ΔP alone dictate your cleaning schedule. A holistic, normalized, and multi-parameter approach is the only way to protect performance and maximize the return on every membrane cleaning.
See also:
 How to Determine the Right CIP Protocol for Your RO System?
What is the expected differential pressure (ΔP) in the first and second stages of a reverse osmosis (RO) system if the feed pressure is 8kg/cm2 (113.8 psi)? What range of differential pressure is acceptable for these stages, and how do changes in differential pressure impact system performance?
Should I focus on soaking or circulation during a Clean-in-Place (CIP)? Which one is more important?
How can you determine whether the membranes in your RO system are damaged?
How to Determine the Right CIP Protocol for Your RO System?
What is the expected differential pressure (ΔP) in the first and second stages of a reverse osmosis (RO) system if the feed pressure is 8kg/cm2 (113.8 psi)? What range of differential pressure is acceptable for these stages, and how do changes in differential pressure impact system performance?
Should I focus on soaking or circulation during a Clean-in-Place (CIP)? Which one is more important?
How can you determine whether the membranes in your RO system are damaged?